What do the various menus do? Where can I find …? This topic is all about navigating the Connectivity Explorer interface.
The Big Picture
When you’re looking at broadband data, you’ll normally 3 areas in the browser window:
- The Application Menu bar is at the top of the page. It’s normally black with white or gray text.
- The Notebook Menu bar is under the Application Menu bar. It holds the choices that control the date views for the active notebook
- The data view is where tables, maps, charts, and other pages appear, together with the controls that manage each particular view.
The Notebook Menu Bar will be hidden when
- You are editing your notebooks,
- You are viewing various documentation pages, or
- You’ve drilled down into some details where the usual Notebook choices don’t apply.
The Application Menu Bar
This is the black bar at the top of the browser window. It contains the following choices:
- The Home Button takes you back to the Overview Page for the Active Notebook.
- The Settings menu leads to your various preferences, including selections for creating and editing you notebooks.
- The Learn menu contains background information about Broadband and Connectivity.
- The Help menu includes selections for finding more information.
- The Policies menu contains links to the terms of service and the privacy policy.
- The Resources contains some useful broadband planning resources. It really should link to []
- The I3 Blog button takes you to https://internet-is-infrastructure.org
- Logout lets you logout.
The Notebook Menu Bar
The Notebook menu bar is only visible when you are looking at the data associated with a specific notebook.
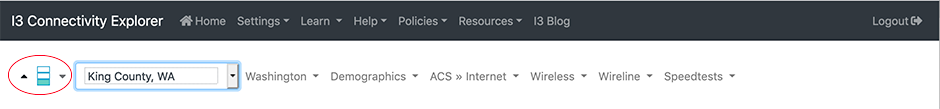
The Zoom Buttons and Zoom Indicator
The Zoom buttons allow you to quickly shift to wider (e.g. Place to County to State) or narrower (back down the hierarchy) points of view.
Between the “zoom out/up” and “zoom in/down” buttons is an indicator of where you are located in the hierarchy.
The buttons and the indicator are circled below:
![]() Click on the
Click on the ![]() button to zoom out. (The arrows are black or gray in the application.)
button to zoom out. (The arrows are black or gray in the application.)
![]() Click on the
Click on the ![]() button to zoom back in.
button to zoom back in.
![]() A button will be disabled if the view is already at the limits of the range.
A button will be disabled if the view is already at the limits of the range.
The indicator fills from bottom-to-top as you zoom outward from a specific location. The most common zoom behavior is from a Place to the enclosing County to the enclosing State.
The Active Notebook Chooser
The Active Notebook Chooser is a drop-down menu that allow you to quickly shift your active notebook. Changing the notebook does not leave the current page, so it’s easy to flip between notebooks while comparing data.
The chooser is circled in the screenshot:
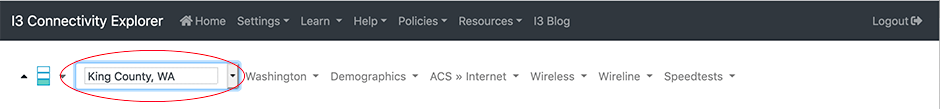
![]() You can easily flip back and forth between multiple notebooks using the “active notebook” menu that appears on all notebook-related pages.
You can easily flip back and forth between multiple notebooks using the “active notebook” menu that appears on all notebook-related pages.
Statewide Views
The menu selections under the Statewide menu all use state-wide measures for the state (or states) being viewed.
The statewide menu is named after the states associated with any locality in the notebook. For example, if we’re looking at King County, WA, the name of the menu will be “Washington”. If your notebook spans multiple states, all of the state names will appear in the menu title.
Here’s another screenshot:
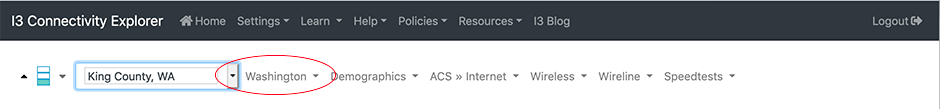
![]() When you select a menu item within the Statewide menu, the usual per-Notebook menu selections are disabled, and new navigation choices appear. When this happens there will be a button that says ""Back to " that will return you to normal browsing.
When you select a menu item within the Statewide menu, the usual per-Notebook menu selections are disabled, and new navigation choices appear. When this happens there will be a button that says ""Back to " that will return you to normal browsing.
![]() State wide views are different than zooming to the state level!
State wide views are different than zooming to the state level!
![]() State wide views hide the usual Notebook Menu Bar. Instead, there is a button that returns you to Notebook-level browsing.
State wide views hide the usual Notebook Menu Bar. Instead, there is a button that returns you to Notebook-level browsing.
Demographics
The demographics menu provides access to a number of common demographic measures. All of them except the summary table plot distributions on a map.
ACS > Internet
The ACS > Internet menu provides 3 pairs of data views based on data from the American Community Survey:
| Category | Summary Table | Map View |
|---|---|---|
| Subscription Information | ||
| Devices in the Home | ||
| Subscriber Characteristics |
Each view has several levels of detail.
Wireless and WIreline Menus
These two menus draw on FCC 477 provider information to give you lists of providers and maps of the areas in which they are active. You can drill-down on the areas served by a single provider to see the areas at the Census Block level.
Speedtests
The SpeedTests menu is where the Measurement Lab data can be displayed. The view itself is complex, and allows you to switch between download and upload speeds, set the date range, and more!
The Overview Page
The overview page (see the screenshot for King County below) provides a capsule summary of the localities in your notebook. Some users find that it has all the information they need for their talking points. I think of it as a double-check that I’m looking at the right locations.
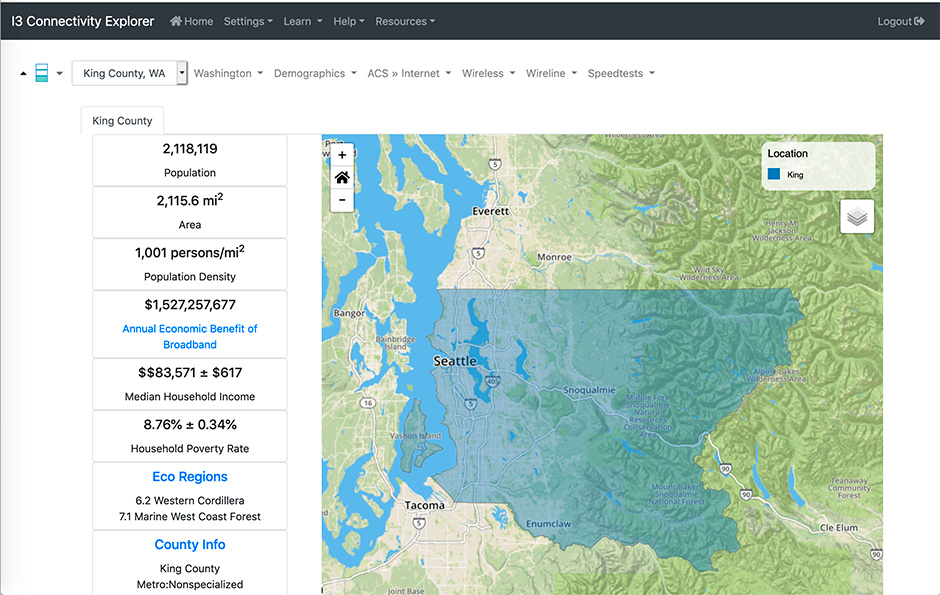
The page consists of an overview map of the localities in the notebook, plus some key indicators.
Tips
![]() The following indicators appear only on the Overview page. They are documented within the help system of the Connectivity Explorer
The following indicators appear only on the Overview page. They are documented within the help system of the Connectivity Explorer
- Annual Economic Benefit of Broadband
- Eco Regions
- County Info
![]() If you have multiple localities in the notebook, there will be a tab for each locality. Click on the tab to switch localities.
If you have multiple localities in the notebook, there will be a tab for each locality. Click on the tab to switch localities.
![]() You return to the home page in two different ways:
You return to the home page in two different ways:
- Click the page header that says “Connectivity Explorer” in the Application Menu Bar at the top of the page.
- Click the “Home” button, also in the Application Menu Bar at the top of the page.
![]() When If you are editing your list of notebooks, and choose to active a different notebook, you’ll be taken back to the Overview page.
When If you are editing your list of notebooks, and choose to active a different notebook, you’ll be taken back to the Overview page.
Notebook Settings
Your notebook settings are applied to many of the views used your notebook.
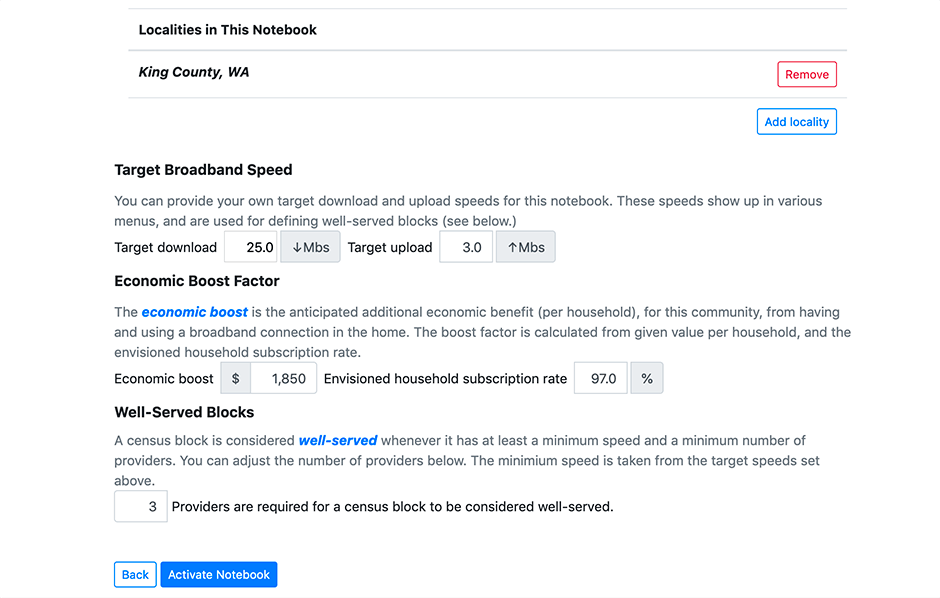
![]() The target broadband speed sets your desired download and upload speed for this notebook. It defaults to the FCC goal of 25Mbs↓/3Mbs↑. You can set your sights higher!
The target broadband speed sets your desired download and upload speed for this notebook. It defaults to the FCC goal of 25Mbs↓/3Mbs↑. You can set your sights higher!
![]() The economic boost factor and target subscription rates are used to compute the economic impact of broadband.
The economic boost factor and target subscription rates are used to compute the economic impact of broadband.
![]() You can also set your minimum number of providers for a block to be categorized as “well served”.
You can also set your minimum number of providers for a block to be categorized as “well served”.
That’s it! Click " Activate Notebook " to start looking at data! The first page you’ll see is the Overview page for your active notebook.